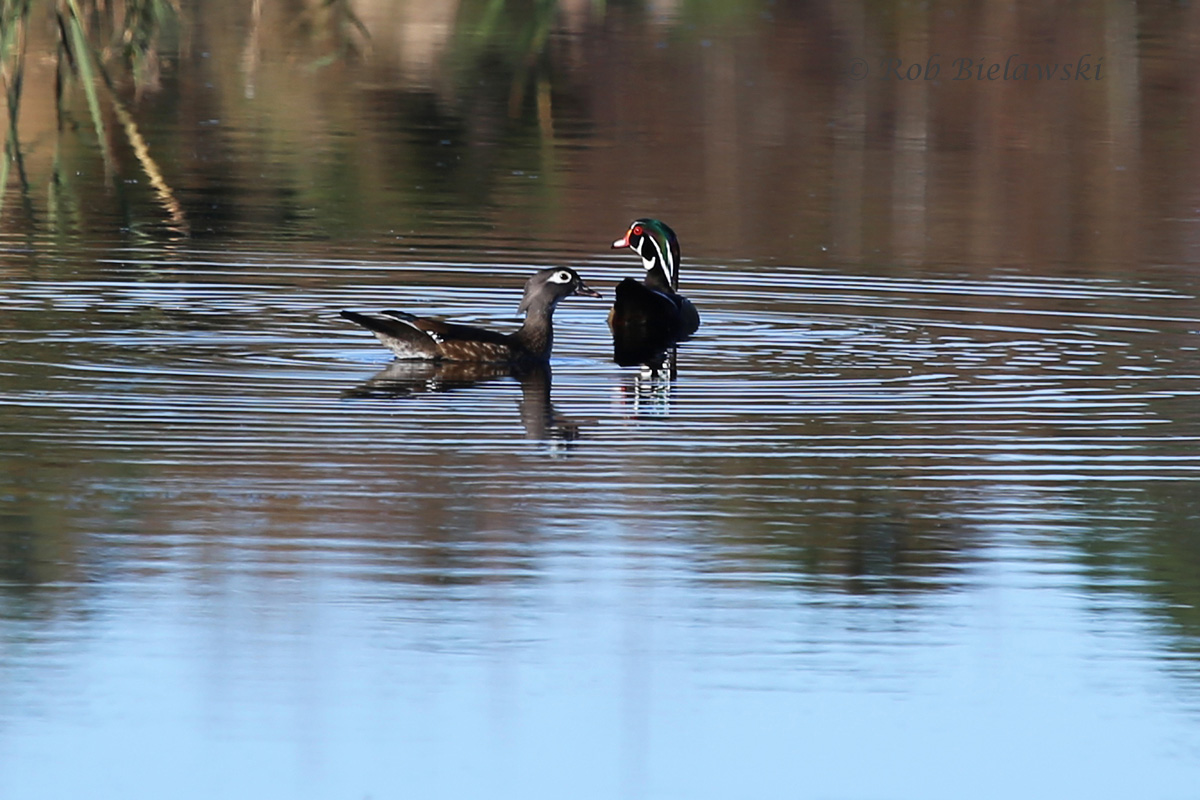
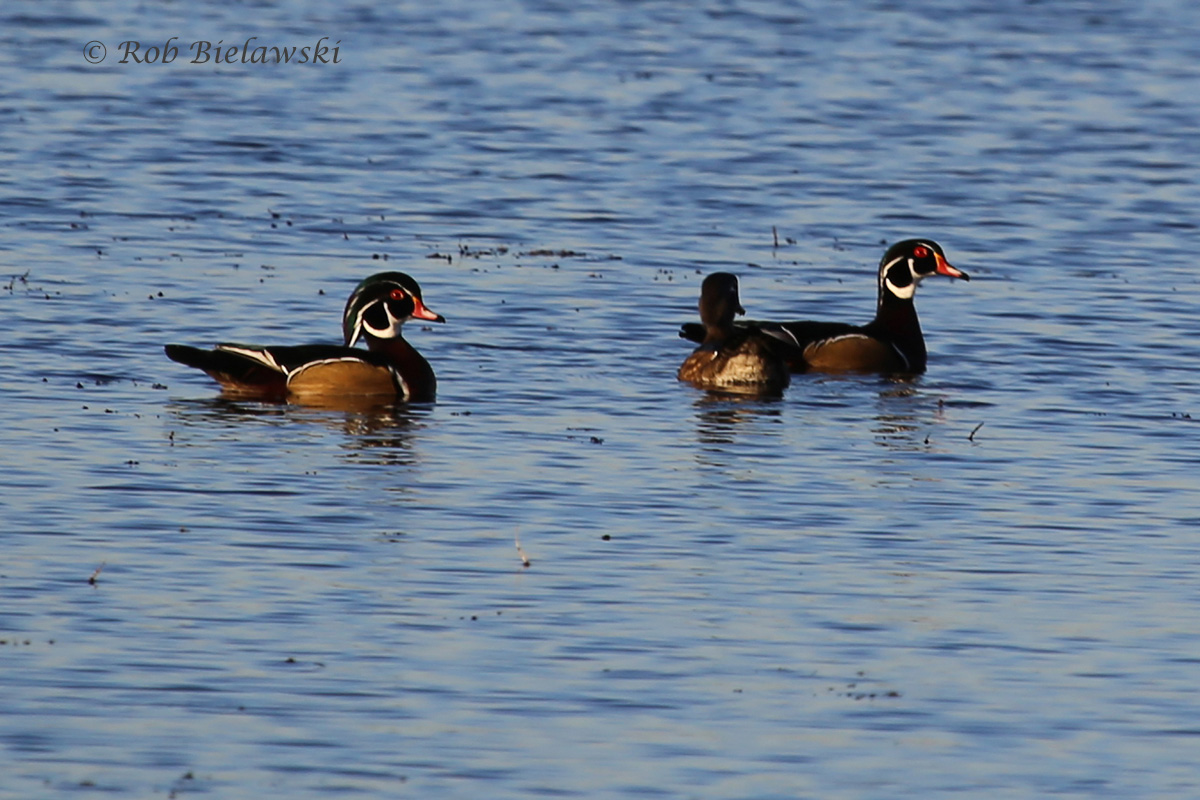
Wood Duck (Aix sponsa)
Adults (Both Males & Females)
Observations in Virginia Beach
By clicking any of the links in the table below, a map will be pulled up on your screen. This map is provided by the website, www.eBird.org, and it shows all the locations where eBird members have reported observations of this species during the selected time frame. For extremely abundant species, a purple color may cover the map. If this occurs, you will need to Zoom-In in order to see specific reports. To zoom in on the map, roll the mouse wheel forward; to zoom out, roll the mouse wheel backward. To pan, left mouse-click the screen, hold down, and drag in the desired direction, then release mouse. Once the purple coloring goes away, or if it wasn't there initially, you will see Orange & Blue "markers". These Markers represent observations, Orange being recent (within the past 30 days), and Blue representing older observations. By left mouse-clicking on either color marker, you will see information pertaining to the date of observation, quantity of the species being reported, observer identity, and additionally, you may click the "Checklist" text to pull up a particular report.
| Distribution of Observations Reported to eBird.org | |||||||||||||
| Timeframe | All Months | Jan | Feb | Mar | Apr | May | Jun | Jul | Aug | Sep | Oct | Nov | Dec |
| Current Year | Map | Map | Map | Map | Map | Map | Map | Map | Map | Map | Map | Map | Map |
| Last 10 Years | Map | Map | Map | Map | Map | Map | Map | Map | Map | Map | Map | Map | Map |
| All Years | Map | Map | Map | Map | Map | Map | Map | Map | Map | Map | Map | Map | Map |
| Frequency of Reported Occurrence (%) | |||||||||||||
| Timeframe | All Months | Jan | Feb | Mar | Apr | May | Jun | Jul | Aug | Sep | Oct | Nov | Dec |
| All Years | 5.03 | 2.47 | 2.63 | 5.29 | 5.61 | 4.94 | 5.22 | 6.88 | 4.05 | 5.42 | 8.14 | 9.46 | 5.68 |
The "Frequency of Reported Occurrence" displayed above is also based on the observations that have been submitted to www.eBird.org by its member base. The numbers in each column represent the percentage of reports that this particular species shows up in during the selected time frame. Since these numbers are percentages, the maximum number is 100, and the lowest number is 0 (represented by a hyphen to accentuate a complete lack of records). If a species shows up 20.0% of the time, one can equate this to "This species is reported by 1 in every 5 checklists over the given time period". These numbers are based on the eBird database for Virginia Beach as it stood on January 1, 2015, when 8,232 checklists had been submitted. Updates to these numbers will be released as needed. Please note: The Frequency of Reported Occurrence does not represent the exact number of individuals of a species observed. For example, there has been only a single Crested Caracara observed in Virginia Beach, but it was reported to eBird by 19 individuals over a 3-day span. This raised its Frequency of Reported Occurrence for the month of November to 2.45%. This percentage is meant to be used as means of comparison to see how often a species is reported by other birders in varying months of the year. Clearly, the odds of finding a Caracara in Virginia Beach are slim, but based on the data so far at hand (a sample size of 1), November is the month that offers the best odds at observing one. Use of this table should allow birders to target a species when it is most commonly reported by other birders in our area.
Links to Credible Species Information
Cornell University & AOU's Birds of North America AllAboutBirds.com Audubon's Guide To North American Birds VIREO